Every developer has faced the frustrating moment of thinking, "This should be working!" Yet, applications don’t always behave as expected. This is usually due to errors either syntax errors, which Node.js alerts you to immediately, or logical errors, which are harder to catch and go unnoticed by the compiler.
While some errors are self-explanatory, others are vague and require deeper inspection. As developers, it's our job to uncover the root cause whether it’s through logging, isolating code blocks, or stepping through the application. Getting things right is crucial.
This article explores several strategies for debugging Node.js applications beyond just using console.log.
Debugging is the process of identifying and resolving bugs within a program. These bugs may appear during development or after deployment in production environments. While fixing bugs during development is relatively safe, production bugs pose more risk by potentially disrupting user experience.
Thankfully, there are effective methods to debug live applications as well.
Instead of scattering console.log() throughout your code—which may not even run if the issue lies elsewhere—consider using Node.js’s built-in debugger statement. It lets you pause execution and inspect the application’s state at specific points.
For example, in a file named test.js:
console.log('hello')
function hi() {
debugger;
consol.log('hi')
debugger;
}
hi();
console.log('hi')
To run this file with Node.js, run the following command:
node inspect test.js
The inspect flag enables the debugger to pause where debugger is used. As execution proceeds (cont in the debugger shell), you'll be able to view the application’s state and spot issues—like the typo consol.log. Even though this example involves a syntax error, this tool is especially helpful for tracing logical bugs.
The expected results are:
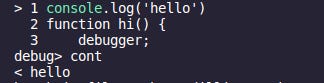
1. Beginning statement
This is the beginning of the application. Upon entering `cont` (which means continue execution) Node.js prints out 'hello', then stops at the first breakpoint. See that in the next process.
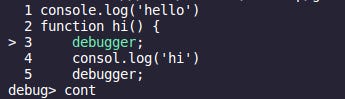
2. The first debugger
Upon entering cont again, Node.js attempts to continue execution.
3. Getting to the second debugger
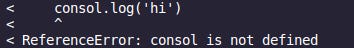
And then, the reference error.
This is a very small example and it's a syntax error, but it shows how the tool works. This tool can also be used for logical errors in which you'll place the debugger at positions where you want to know the current state of the application.
Browser-based debugging is often easier than using the terminal, thanks to tools like Chrome DevTools. Node.js allows you to use the --inspect flag to open your application in the browser and debug with breakpoints, step-through execution, and state inspection.
Don’t confuse --inspect with inspect used in the terminal they serve different purposes. More details are available in the Node.js documentation.
Writing tests may seem tedious, but they’re invaluable. Unit tests and end-to-end tests help define expected behavior and catch unintended changes quickly.
For instance, if a new feature introduces a bug, existing tests will likely fail—pinpointing the source of the issue quickly.
Various testing frameworks are available to help you get started, such as Mocha, Jest, and more.\
Beyond basic console.log, Node.js provides other methods like console.error, console.warn, etc., which are useful for categorizing messages.
In production environments, direct server access to check logs isn’t ideal. That’s where log management tools like Rookout come in—they can automatically collect logs and send them to a dashboard or external service for easier monitoring and debugging.
Modern code editors like Visual Studio Code offer integrated debugging tools for Node.js. With a few configurations and extensions, you can inspect variables, set breakpoints, and step through code—all from within your IDE.
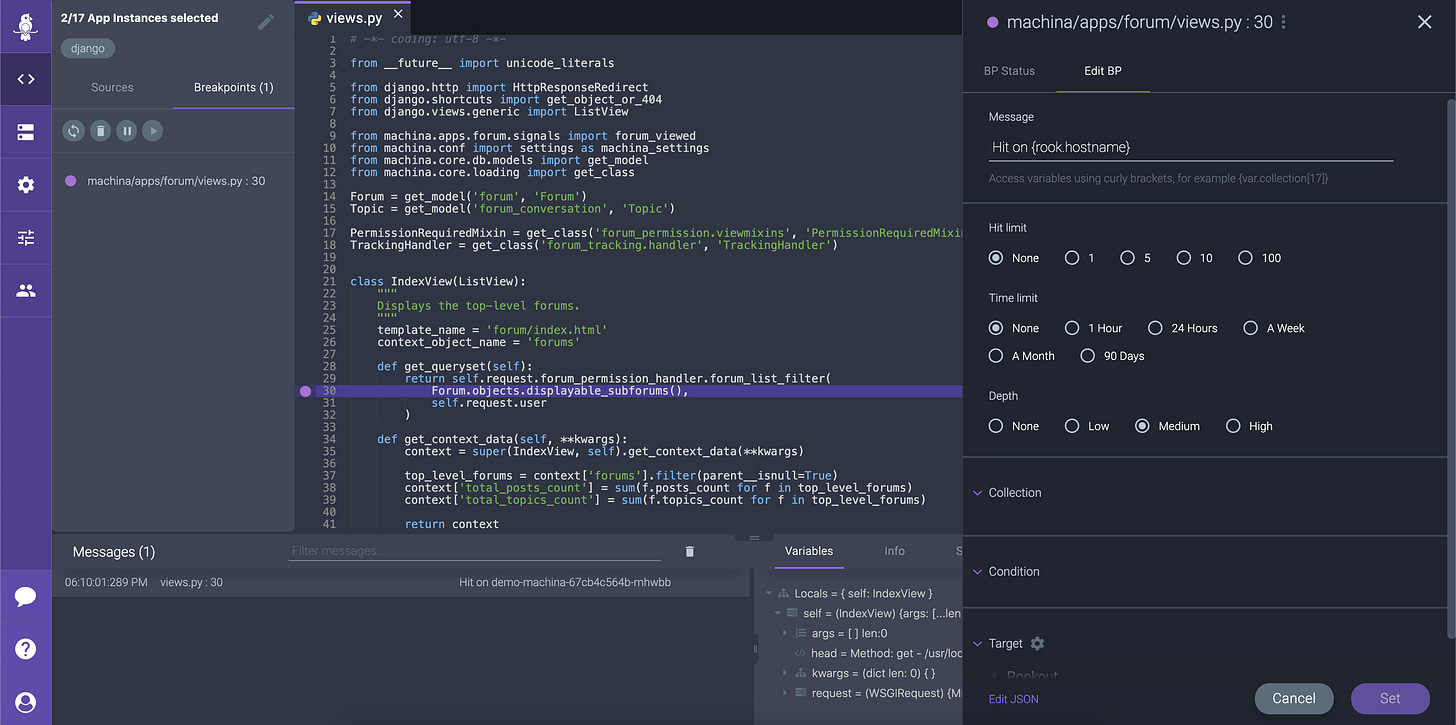
Rookout also offers a web-based IDE that enables you to insert breakpoints and log messages dynamically, without altering your source code. This is especially useful for real-time debugging in production environments.
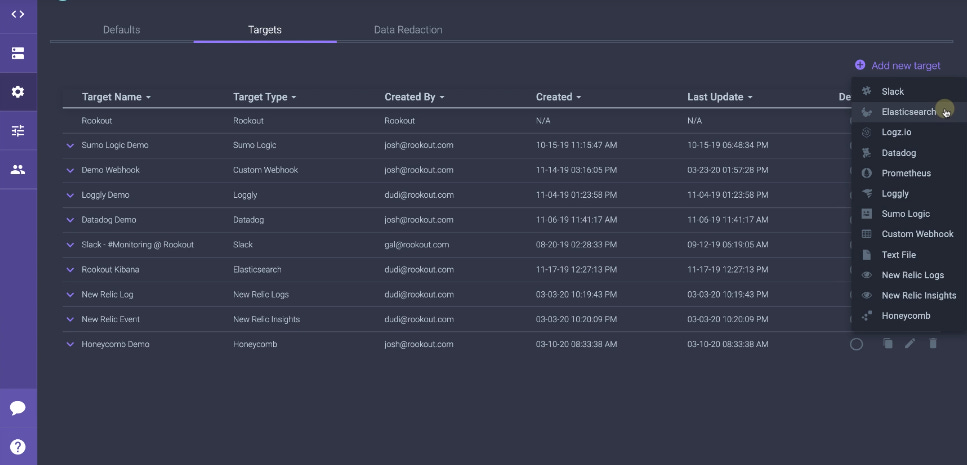
The image below shows a brief usage of the IDE:
From the image, you’ll notice how quick it is to add breakpoints in your application and log different messages without having to alter your code (adding console.log s) at all. This makes debugging much easier.
Bugs are an unavoidable part of software development, and debugging them can be frustrating. However, by adopting the strategies outlined above—using debuggers, writing tests, managing logs, and leveraging modern IDEs—you can streamline the debugging process and deliver more reliable applications.